# Monitoring
ELO Flows provides a monitoring tool. In this tool, you can monitor the processing of flows and analyze errors.

- Select Monitoring in the flow administration area.

The Status Report page opens. The page consists of the following tabs:
- Version: Shows the version of ELO Flows currently being used
- Messages: Shows current status messages
- Flows: Shows the available flows with the corresponding statistics
- Flows timeline: Shows the timeline of executed flows and, if applicable, errors in the list. The list can be updated, searched, and filtered
- Validation errors: Shows any errors and error sources in flows and transformations
- Controls: When you select the Refresh Cache button, the ELO Flows Manager reads the database contents again
Alternatively, you can perform manual troubleshooting, supported by the following status pages.
# Status pages
Multiple status pages are available, which you can check. In addition to the currently installed version number, they also indicate the online status of the modules:
# Simple status page of the ELO Flows Manager

The manager offers a very simple status page that only shows the status and can be used without authenticating:
http://<hostname>:<port>/flows/status
# Flow administration status page
You can reach the flow administration status page at the following URL:
http://<hostname>:<port>/ix-<repository>/plugin/de.elo.ix.plugin.proxy/flows/#/status
# ELO Flows registry status page
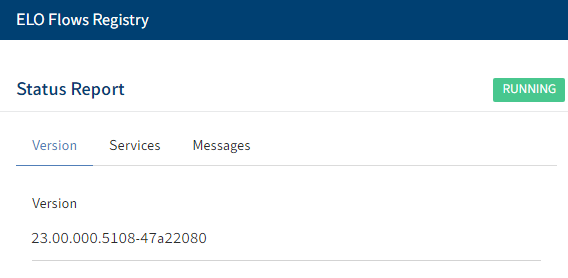
You can reach the ELO Flows registry status page at the following URL:
http://<hostname>:<port>/registry
Information
Change the host name and port based on the respective installation.