# 'Content' tab
Metadata forms have to be configured before you can use them. The following settings are configured on the Content tab.
# Inheritance
Metadata forms can pass settings on to other metadata forms.
For example, a parent metadata form Media can pass settings down to derived metadata forms DVD and Book. The Media metadata form acts as a parent category. The inheriting metadata forms can also have their own aspects and fields in addition to the ones they've inherited.
Configure inheritance for a metadata form as follows:
Select Edit inheritance.
The Edit inheritance area opens.
Select one or more metadata forms that the current metadata form should inherit from.
Select Apply.
The selected metadata forms are entered in the Inherit from field.
Please note
The aspect mappings of the parent metadata forms are not shown in the inheriting metadata form.
You can perform additional aspect mappings, but this isn't necessary.
Select Save metadata form.
The metadata form is created with inheritance. The inheriting metadata form automatically uses the views of the parent metadata form if no custom views have been created.
# Assign aspects

To fill the metadata form with aspects and forms, you have to assign aspects to the metadata form.
Select Add aspect mapping.
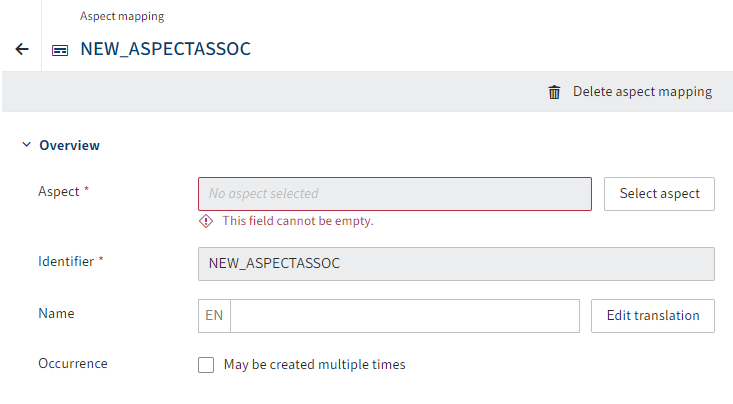
The configuration area for aspect mappings opens.
Select Select aspect.
The selection list for available aspects opens.
Select a suggestion.
The identifier and name of the aspect are applied to the aspect mapping.
Information
You can change the identifier, name, and translations at a later point as needed.
Edit the following configuration options as needed.
May be created multiple times: If this option is enabled, the behavior of the aspect in the form changes. A plus icon appears that can be used to add the aspect to the metadata form multiple times.
Please note
If the May be created multiple times option is enabled and the metadata form is saved, this setting can no longer be undone.
Aspects with the May be created multiple times option enabled cannot provide metadata in child entries.
Example: Using an aspect multiple times makes sense if you've created an aspect for telephone numbers, for example. Instead of creating a separate aspect for all types of telephone numbers, use a basic type and enable the option May be created multiple times for it. Users can add as many telephone numbers as they'd like, as needed.
warning Please note
The view for the aspect must be created with the List type if you want to enable the option May be created multiple times for the aspect mapping. :::
Permissions: If necessary, edit the permissions settings for the aspect mapping.
With the default settings, the aspect mapping can be used and seen by everyone.
Select Save metadata form.
The aspect mapping is saved. Add more aspect mappings in the same way as needed.
# Create views
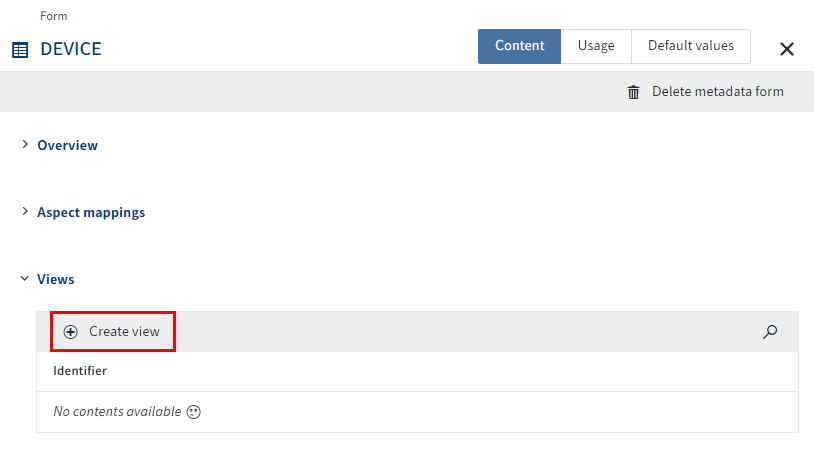
Once all the required aspects have been assigned to the metadata form, you have to create views for the form.
Select Create view.
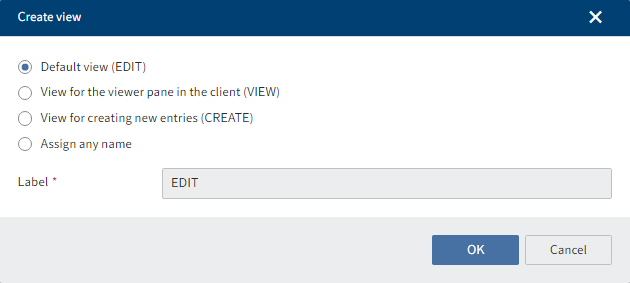
The form designer (gen. 2) opens. The Create view dialog box is open.
Select a type via the radio buttons.
Choose from the following options:
- Default view (EDIT): If no other view is available, ELO attempts to access this view, including for other purposes. This view should therefore always be created.
- View for the viewer pane in the client (VIEW)
- View for creating new entries (CREATE)
- Assign any name: Create a custom type. In this case, you have to enter a name in the Name field.
Select OK.
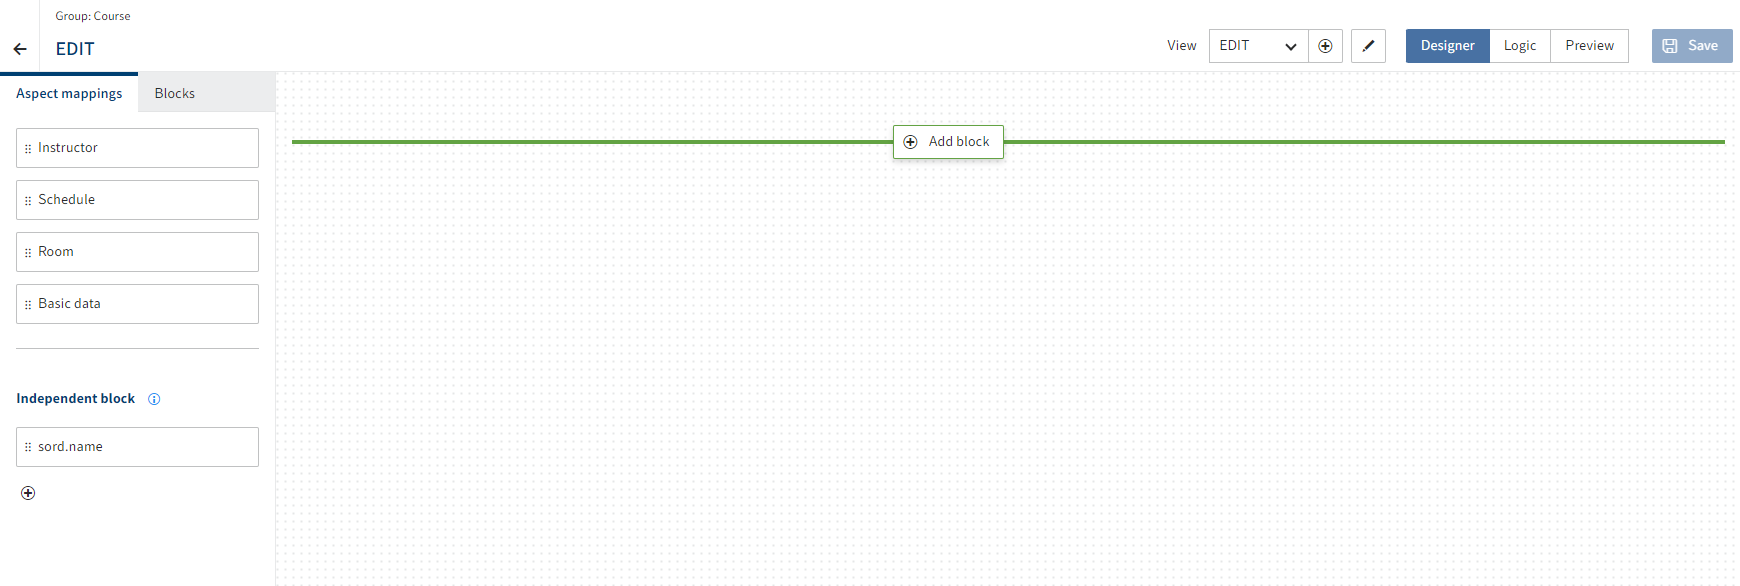
This closes the dialog box. You are now in the form designer (gen. 2).
You will find more information about the elements and functions of the form designer under Forms (gen. 2)
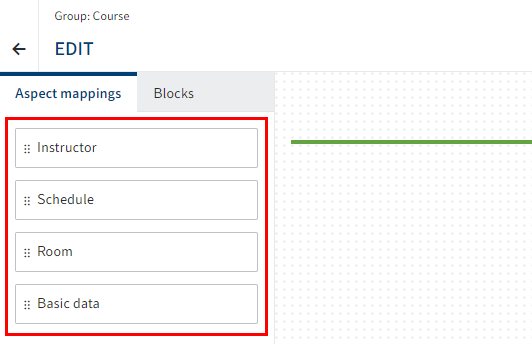
On the Aspect mappings tab, you will see the aspect mappings of the metadata form.
Drag an aspect mapping to the layout area using drag-and-drop.
The aspect mapping is placed in the designer. If available, one of the aspect's views is selected.
The Properties tab opens.
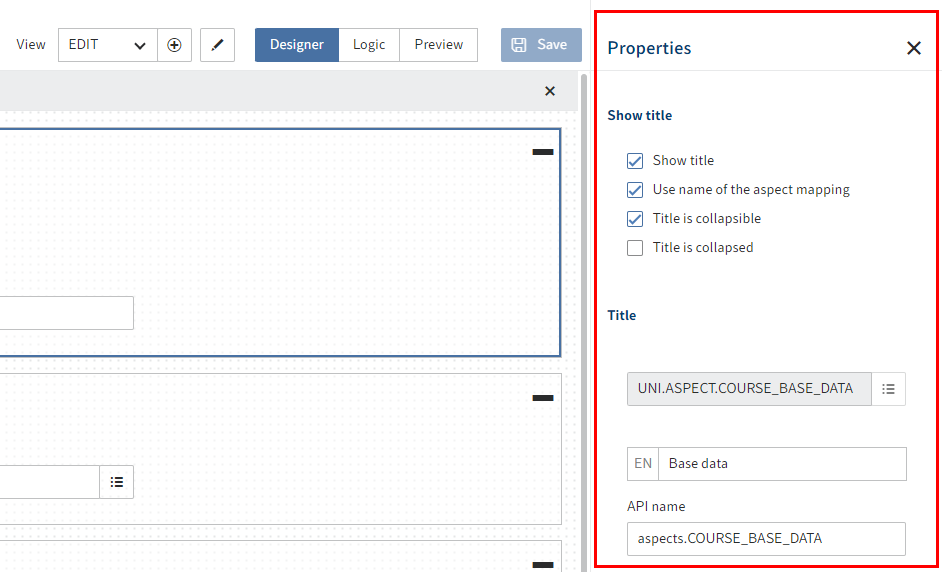
If required, edit the settings for the aspect mapping on the Properties tab.
Choose from the following options:
- Show title: If this option is enabled, the name of the aspect mapping is shown as the title. If available, translations are shown in other languages.
- Use name of the aspect mapping: If this option is disabled, you can define an alternative title and, if applicable, corresponding translations using the fields in the Title area.
- Title is collapsible: If this option is enabled, the aspect mapping can be expanded and collapsed.
- Title is collapsed: If this option is enabled, the aspect mapping is collapsed by default. This option is only available if the Title is collapsible option is enabled.
- Translation variable: If the option Use name of the aspect mapping is disabled, you can enter or select an alternative translation variable for the aspect mapping in this field.
- Name: If the option Use name of the aspect mapping is disabled, you can enter an alternative name for the aspect mapping in this field.
- API name: This is the technical identifier of the aspect mapping.
- View: Select a different view for the aspect mapping as needed.
Repeat these two steps until you have placed all the desired aspect mappings.
Select Save.
The view is saved and is now available. The metadata form can be used in the clients.
# Create quick view
You can create quick views for each metadata form as required. They are intended as a preview for relations and to to present the most important data from the relation. The preview is shown when you move the mouse over the chain icon of a relation in the client.

Select Add quick view.
The form designer (gen. 2) opens. The Create view dialog box is open.
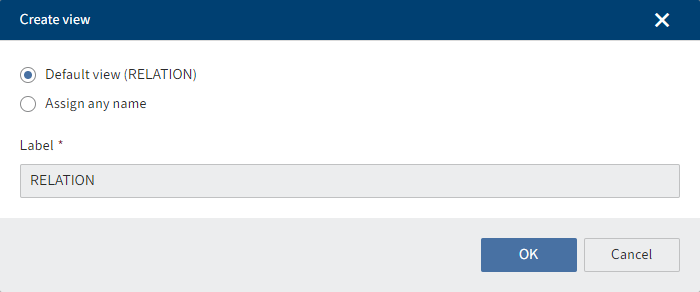
Select a type via the radio buttons.
Choose from the following options:
- Default view (RELATION): If no other view is available, ELO attempts to access this view, including for other purposes. This view should therefore always be created.
- Assign any name: Create a custom type. In this case, you have to enter a name in the Name field.
Select OK.
This closes the dialog box. You are now in the form designer (gen. 2).
The next steps are the same as for Create views (see above) starting with step 4, but with a limited selection of options.
# Create dashboards
Dashboards display statistical analyses of the data filed with the metadata form in workspaces and in the search.

Select Add dashboard.

The form designer (gen. 2) opens. The Create dashboard dialog box is open.
Enter a name for the dashboard.
Select one of the available translation variables from the drop-down menu. The Display name field is completed automatically.
Alternative: Enter a new translation variable into the Translation variable field. In Display name, enter a name for the dashboard in the respective display language.
Select OK.
This closes the dialog box. You are now in the form designer (gen. 2).
You will find more information about the elements and functions of the form designer under Forms (gen. 2)
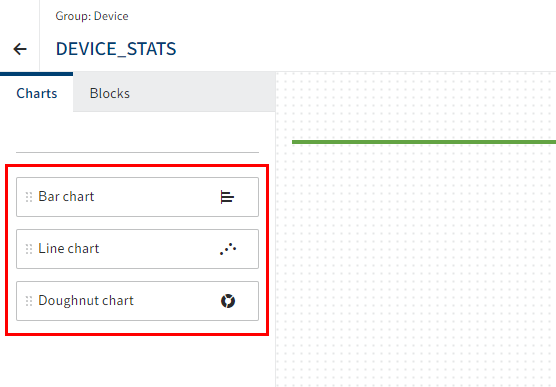
On the Charts tab, you can choose between the following chart types:
- Bar chart
- Line chart
- Doughnut chart
Drag a chart type to the layout area using drag-and-drop.
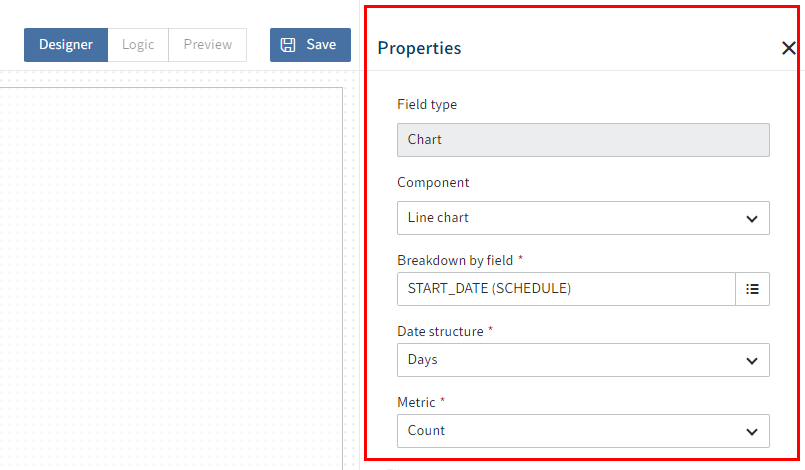
Under Properties, you can configure the chart.
The following configurations are possible:
- Component: You can change the selected chart type at a later point.
- Alignment: In a bar chart, for example, you can select whether you want to arrange the bars vertically or horizontally.
- Breakdown by field: The chart is based on a field with aspect mapping from the metadata form. Select a previously created field for the chart in the drop-down menu. Additional settings are available depending on the field type selected.
- Metric: Different metric selections are available depending on the field type. While Count is especially suitable for field types such as keyword lists or text, use Average, Minimum, Maximum, Total for numeric field types.
- Filter: Select New entry (plus icon) to add a field with aspect mapping as a filter.
- Color palette: Select a color scheme for the chart.
- Mapping type: You can assign colors by selecting the pencil icon next to the Mapping type field. You will find more information in the following Configure mapping section.
- Title translation key: The field name is applied by default. If needed, select a different translation variable for the title of the dashboard.
- Title: Select a title for the dashboard. Otherwise, the field's technical name is shown.
- Subheader localization key: Select a translation variable for the dashboard subheader as needed.
- Subheader: Select a subheader for the dashboard as needed. This can help users better understand the purpose of the chart.
- Size: Select a size for the chart. This determines how the chart is arranged on the dashboard relative to other charts. The way the charts are arranged adapts to the size of the screen.
Repeat these two steps until you have placed all the desired charts.
Select Save.
The dashboard is saved and is now available.
Information
For fields with the assigned localization key field there are two optional methods:
- Available translation variable: Select one of the available translation variables from the drop-down menu. The Name field is completed automatically.
- Manual entry: Enter a new translation variable manually. Enter a name in the Name field. The data is saved automatically.
# Configure mapping
For color palettes, you can assign specific colors data values. This makes sense for multi-color color palettes.
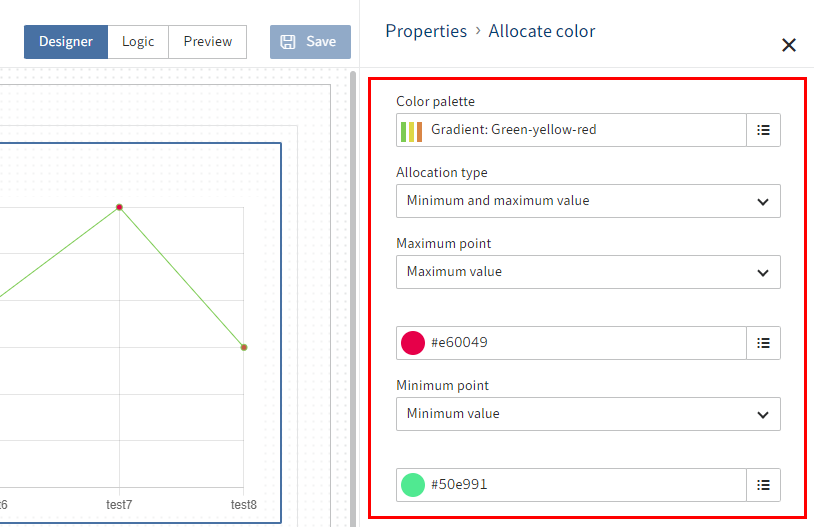
Select the pencil icon beside the Mapping type field.
Select a mapping type.
- Minimum and maximum value: Assign the minimum value a different color than the maximum value.
- Threshold: Define a threshold. All values below the threshold are assigned a different color than the values above the threshold.
- Rule-based: Define one or more rules as to which color should be assigned to which value/value range.
Select Apply.
The mapping type is saved.