# Profiles
# Using ELOas debugger profiles
The upper right area of the main ELOas debugger window contains a drop-down menu with the ELOas debugger profiles. This drop-down menu contains 10 profiles. Each profile can be uniquely identified based on the profile name.
When you select a profile, the relevant graphic dialog components are refreshed. The list of existing ELOas rules is also refreshed when you change profiles. This list displays the rules from the ELOas debugger profile currently in use. Double-click an ELOas rule to start the debug process for that rule.
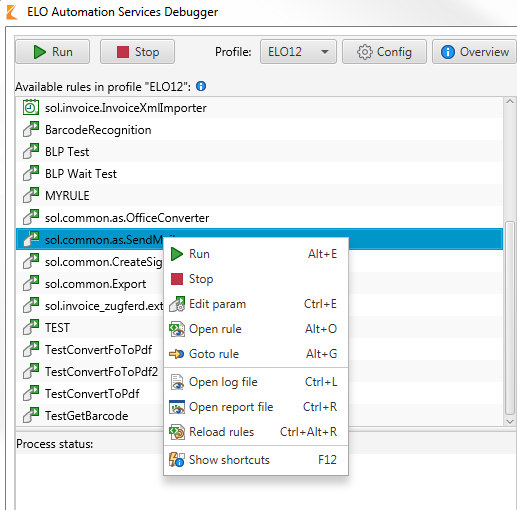
Fig.: Context menu in the ELOas debugger
Right-click a rule to open the list context menu. The following actions are available in the context menu:
Run: Start the debug process for the selected ELOas rule.
Stop: Stop the debug process.
Edit param: Modify the rule parameters. The specific parameters for the direct rule are applied instead of the global rule.
Open rule: Open the rule as a text file.
Goto rule: Open the filing location of the rule in ELO.
Open log file: Open the configured ELOas debugger log file.
Open report file: Open the configured ELOas debugger report file.
Reload rules: Reload the existing ELOas rules.
Show shortcuts: Shows the keyboard shortcuts in the ELOas debugger.
The list of available rulesets also shows the direct rulesets. The individual rulesets are distinguished from one another based on their icon. The type icon of a ruleset contains a corresponding description text.
# Profile overview
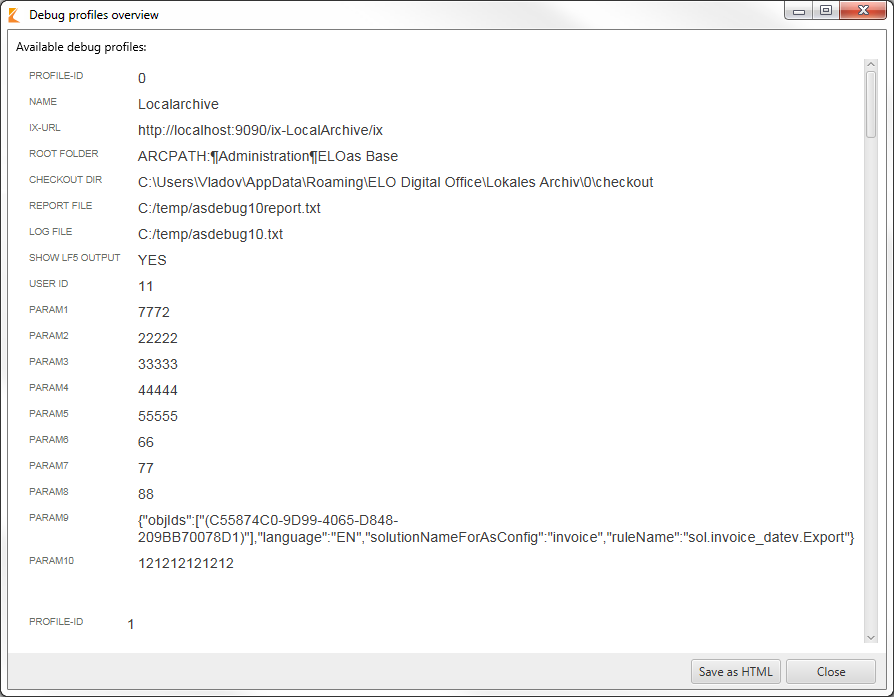
Fig.: ELOas debugger profile overview
Click Overview to open the overview of existing ELOas debugger profiles. The existing profiles are shown on an HTML page. The overview shows the most important properties of a profile. Save the profile overview to the local file system as an HTML file by clicking Save as HTML.
# Information on the selected profile
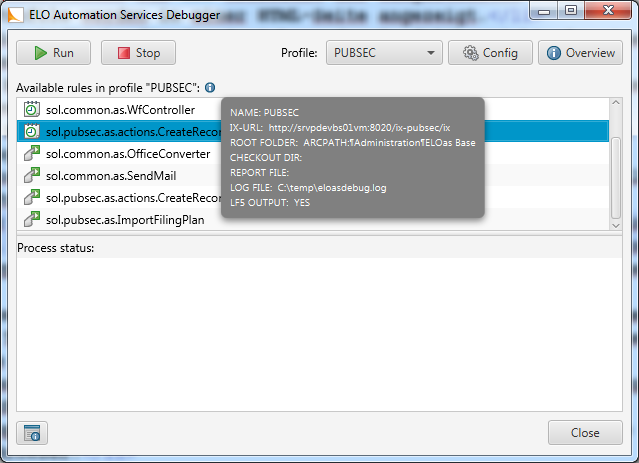
Fig.: Information on the selected profile
The main dialog box of the ELOas debugger contains an info icon that you can click to see the most important data on the currently selected ELOas debugger profile.
# Editing profiles
Edit the active ELOas debugger profile by clicking Config.
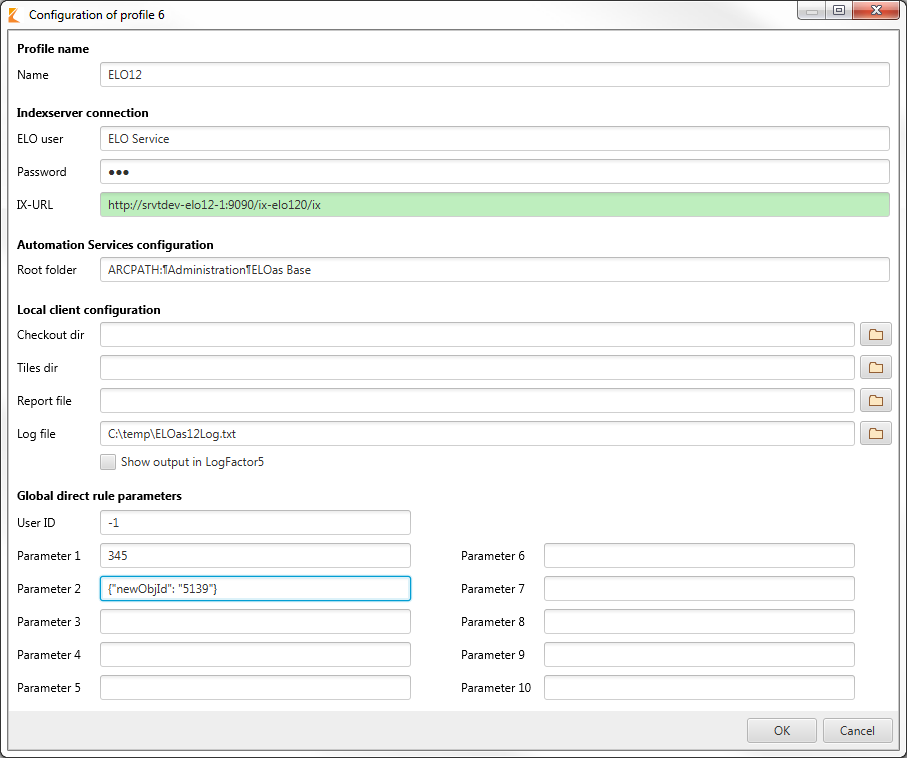
Fig.: Profile configuration dialog box
The title of the dialog box displays the ID of the ELOas debugger profile being edited. The user password is hidden in the user password text field.
Name: The profile name may contain a maximum of 15 characters.
ELO user: The name of the ELO user.
Password: The password for the ELO Indexserver connection.
IX-URL: The URL of the ELO Indexserver. The text field contains a green background when the ELO Indexserver is available at the specified URL.
Root folder: The path where the ELOas configuration is saved.
Checkout dir: Clicking the button next to the Checkout dir field allows you to select the ELO Java Client checkout directory.
Tiles dir: Clicking the button next to Tiles dir allows you to select the monitored directory for the referenced ELO Dropzone tiles.
Report file: Clicking the button next to the Report file field allows you to select an ELOas debugger report file.
Log file: Clicking the button next to the Log file field allows you to select the log file.
Global direct rule parameters: Here, you can configure the global parameters for direct ELOas rules. You can edit the user ID and ten parameters.
The profile configuration dialog box has a scroll bar that is shown when the dialog box is reduced beyond a certain size.
Click the OK button to save your changes in the system registry. The settings for the current ELOas debugger profile (ID: 1) are saved to the following location in the system registry:
"HKEYCURRENTUSER\Software\JavaSoft\Prefs\elo digital office\eloas.1".
Click Cancel to discard your changes and close the dialog box. You can also press the ESC key to close the ELOas debugger profile configuration dialog box. The dialog box has a minimum size setting. When you enlarge the dialog box, the individual components of the dialog box are enlarged proportionally. This allows you to display long profile inputs.
# Editing direct rules
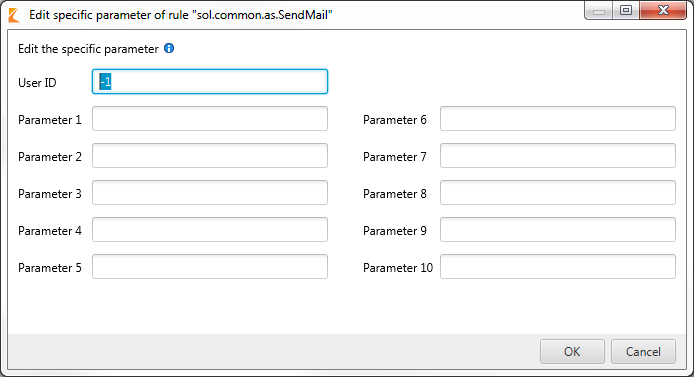
Fig.: Dialog box for editing direct rules
In this dialog box, you can edit the specific parameters of a direct rule. You can reach this dialog box via the context menu by selecting a rule in the list of available rules. In this dialog box, you can edit the user ID and the ten available parameters.
# Changing profiles
If you have edited the profile and want to switch to another profile, you will have to restart the ELOas debugger.
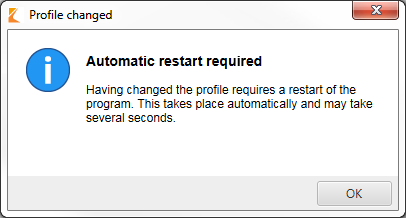
Fig.: Message dialog box indicating automatic restart after changing profiles