# Overviews
Reports and dashboards help give you an overview of your contracts.
# Reports
Information
You can create reports to analyze contracts. A report is filed to your repository as an Excel table. When you create a report, it is only visible to you.
Reports are based on templates. These templates filter the contracts based on specified criteria.
The following reports are available:
- Contract report: This report type creates a report with the values within the selected folder.
- Cash flow: This report type creates a report with the cash flows for all contracts.
Method
Select the folder you want to create a report for.
Information
The contracts do not have to be located directly below the selected folder. But the more child folders there are, the more time it will take to create the report.
On the New tab, click Contract > Create contract report or Contract > Create cash flow.
Optional: Select a report template. If only one report template has been created, it is selected automatically.
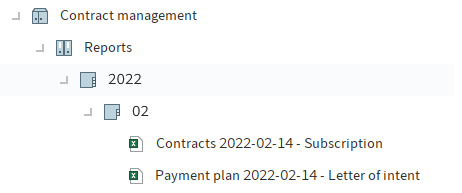
Result: Contracts

Fig.: Reports in the repository
The document with the contract overview opens and is created under Reports by default.
By default, the report contains the Table1 and Data tabs.
Under Table1, you will find a visualization of the selected contracts. With a pivot table, you can customize the report and use it for calculations.
Under Data, you will find a list of selected contracts with the information preset in the report template.
Result: Cash flow
The document with the contract overview opens and is created under Reports by default.
By default, the report contains the Data tab. You will find a list of the cash flows here.
# Dashboard
The dashboard provides an overview of all filed contracts.
You can reach the dashboard by clicking the Contracts tile in the My ELO area.
The dashboard remembers your settings. When you close then open the dashboard again, it remembers and displays your most recent view.

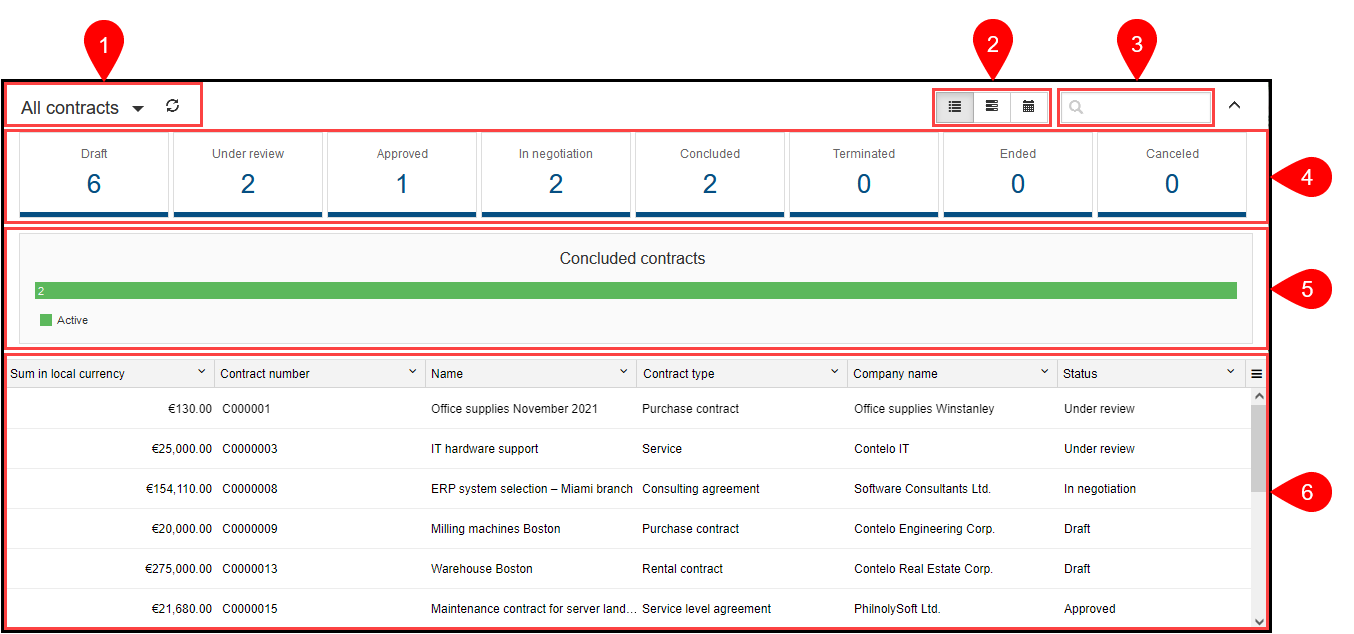
Fig.: Dashboard in the table view
The dashboard is divided into the following areas:
1 Database: In the dashboard header, use the drop-down menu (arrow icon) to select a database. A dashboard database is a list of contracts that is loaded for evaluation.
Information
If there is only one database, this database is selected permanently and no drop-down menu is available.
2 Table/Timeline/Calendar: You can choose between three dashboard views: Table, Timeline, and Calendar.
3 Search: In addition to text values, you can also search for deadlines and amounts. All data that you can select as column values in the table view serves as the basis.
4 Status: The dashboard header contains a button for each contract status. If a button is active, all contracts with the corresponding status are shown in the dashboard viewer pane.
5 Concluded contracts: If concluded contracts exist in the database, a bar appears with the statuses of the concluded contract. Entered contract deadlines serve as the basis.
6 Viewer pane: In the dashboard viewer pane, you will see a list of contracts. This list changes depending on the filter criteria applied.
# Table

Fig.: Table view
Clicking an entry shows a preview of the entry. Double-clicking an entry brings you to the repository.
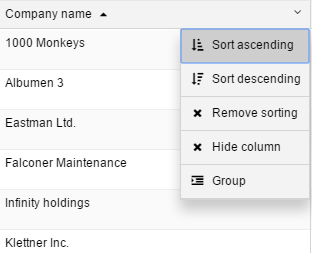
Customize the table view using the drop-down menus.

Fig.: Customizing the table view
The drop-down menus in the column headings contain the following functions:
- Sort ascending
- Sort descending
- Remove sorting: This option appears if you have sorted the column.
Alternative: You can sort the column by clicking the column heading. Clicking once sorts in ascending order. Clicking a second time sorts the items in descending order. Clicking a third time clears sorting.
- Hide column
- Group: The content of a column is joined into groups. The number of contracts in each group is shown in brackets. Click the plus icon before the group to expand it and view all contained contracts. The minus icon minimizes it again. Clicking the plus icon in the header expands all groups.
Information
You can combine multiple groups. You can specify a hierarchy with the order in which you select the columns.
- Ungroup: This option appears if you have grouped items. Click Reset grouping to discard the group.
- Agg: Total (only for number fields and when another column is grouped): The total of the group is shown.
- Agg: Minimum (only for number fields and when another column is grouped): The lowest value of the group is shown.
- Agg: Maximum (only for number fields and when another column is grouped): The highest value of the group is shown.
- Agg: Average (only for number fields and when another column is grouped): The average of the group is shown.
Fig.: Overview of all columns
Menu: You can show hidden columns.
# Timeline

Fig.: Timeline view
The timeline view visualizes the duration of contracts with color bars.
If the beginning or end of the duration is outside of the time frame shown, this is indicated by an arrow at the beginning or end of the bar.
You can recognize the contract status by the color.
- Green: Active contract
- Yellow: Termination deadline coming up
- Red: Contract expiring
- Green-expiring: Contract with extension
The current day is marked with a vertical blue line.
# Calendar
Fig.: 'Year', 'Month', and 'Day' buttons
The calendar offers three options: Year, Month, and Day.
Reminders, termination deadlines, and contract end dates are shown in all views.
Information
Only contracts with deadlines are shown in the calendar view.

Fig.: Annual view
Year: The annual view shows the number of contract deadlines each month. For more detailed information on a month, click the month.
Fig.: Month view
Month: The month view shows the number of contract deadlines each day. For more detailed information on a day, click the day.
To preview a contract, click the contract.

Fig.: Day view
Day: The day view lists the contracts for the selected day. It works in the same way as the table view.